2025–2026 Wellness Analysis
Comprehensive analysis of student wellbeing data across Middle and High School at Delta Global School, examining belonging, positivity, workload management, and peer and teacher support
Interactive Dashboard
Project Overview
This project involved designing, implementing, and analyzing a comprehensive student wellbeing survey at Delta Global School. The research aimed to understand student emotional, mental, and social experiences to identify areas for support and drive positive change in school policies and programs.
Key Objectives
- Understand student wellbeing across emotional, mental, and social dimensions
- Identify key wellbeing challenges including stress, workload, and access to support
- Use data to inform programs, policies, and initiatives to strengthen the school community
- Develop improved data collection methodologies for future assessment
Methodology
The study employed a mixed-methods approach, combining quantitative survey data with qualitative insights to provide a comprehensive understanding of student wellbeing.
Survey Design
Developed a comprehensive survey measuring multiple dimensions of student wellbeing using Likert-scale questions and open-ended responses.
Data Collection
Administered surveys to middle and high school students across three terms (Fall 2024, Winter 2024, Spring 2025) to track changes over time.
Statistical Analysis
Used ANOVA to compare means across multiple groups and terms, identifying statistically significant changes in wellbeing indicators.
Qualitative Follow-up
Conducted focus groups and interviews to contextualize quantitative findings and gather in-depth student perspectives.
Key Findings
Overall Trends
- Student wellbeing remained relatively stable across the school year with minor fluctuations
- High school students reported notable improvement in workload management by Term 3
- Middle school students consistently felt supported by teachers and advisors
- Stress levels remained moderate across all terms with no significant increases
Outlier Analysis
Identified student subgroups whose experiences differed significantly from the overall positive trends, highlighting the importance of looking beyond averages to understand the full picture of student wellbeing.
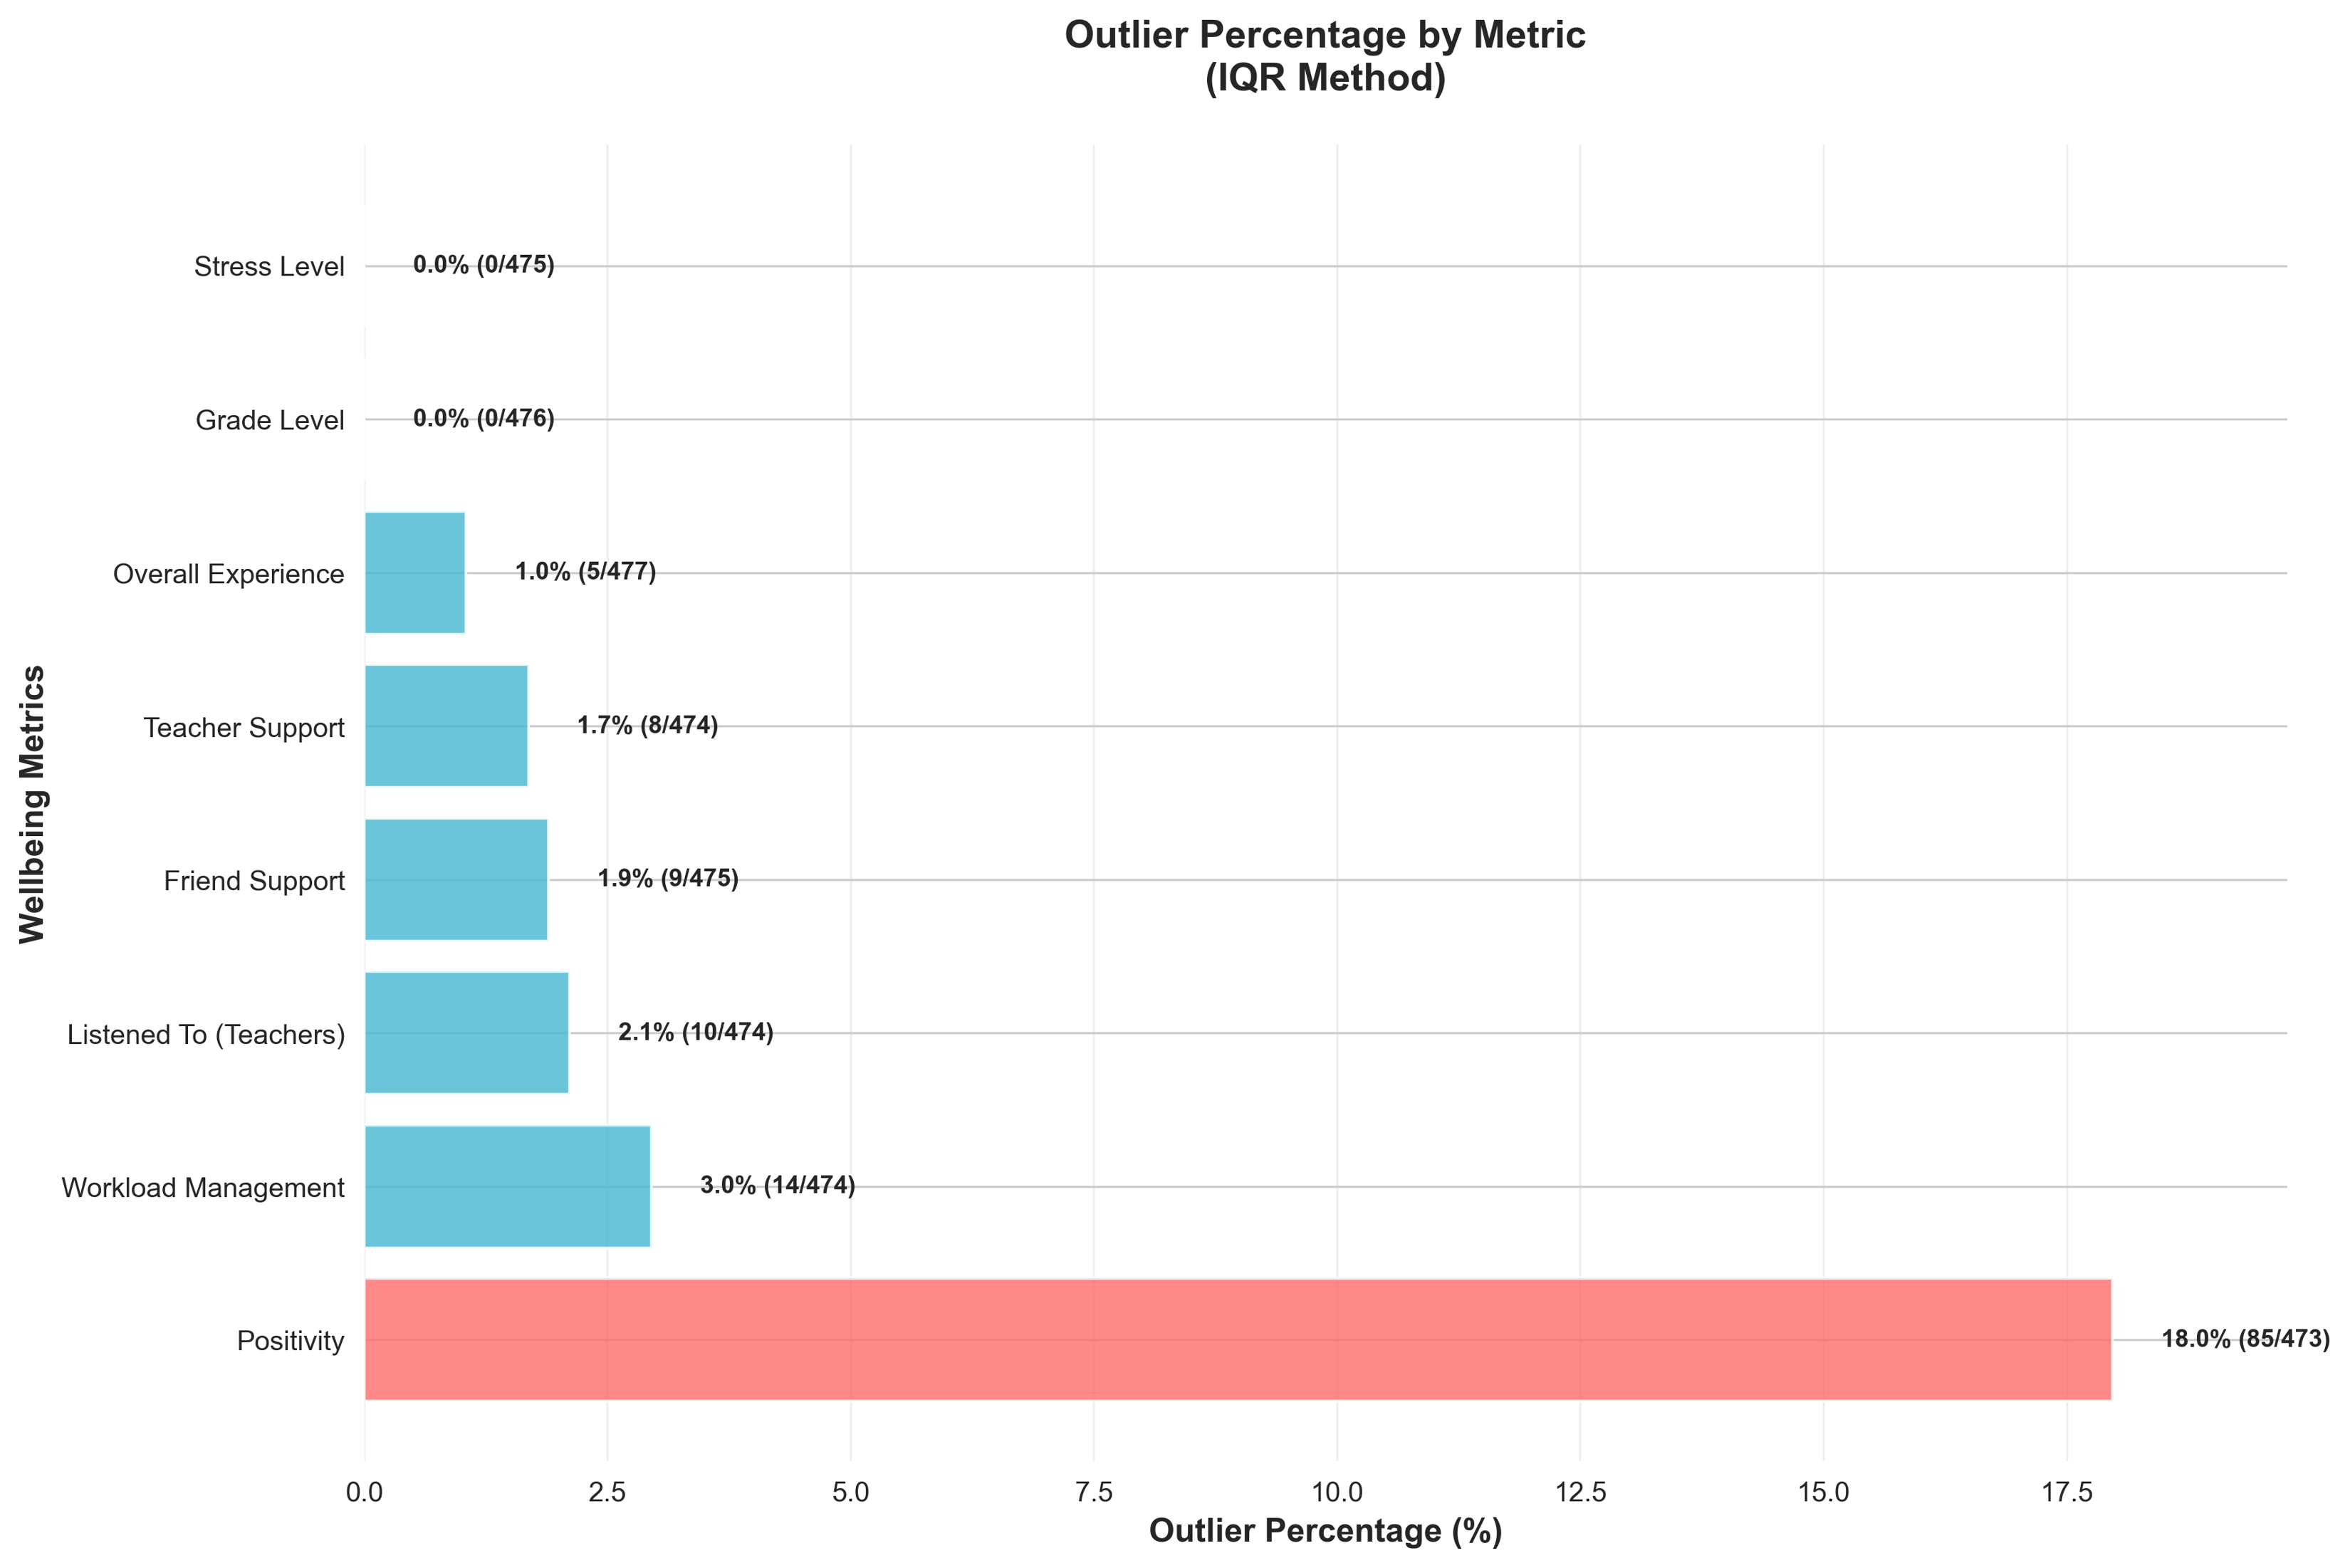
Visualization of outlier students whose experiences differed significantly from overall trends
Critical Questions from Outlier Analysis
- Who are the outliers in our wellbeing data?
- What specific challenges do these students face?
- How can we better support these student subgroups?
- What changes to our data collection would help identify these students earlier?
Statistical Analysis
Used Analysis of Variance (ANOVA) to determine whether changes in wellbeing across terms were statistically significant or due to random variation.
F-value
Measured how much group means differed between terms, with higher values indicating more substantial differences.
P-value
Determined statistical significance, with values below 0.05 indicating changes were unlikely due to chance.
Effect Size (η²)
Measured the practical significance of findings, distinguishing between statistically significant and educationally meaningful changes.
Visualization of ANOVA results showing significant changes across terms
Research Implications
What We Know
- Overall patterns of student wellbeing across the school year
- Areas of strength in teacher and advisor support
- Workload management improvements in high school
- Consistent moderate stress levels across terms
What We Don't Know
- Why certain wellbeing areas improved or declined
- How individual student experiences differ beyond averages
- The impact of external factors (exams, events) on wellbeing
- The effectiveness of current support strategies
Recommendations & Future Research
Proposed Data Collection Improvements
- Collect demographic data to better identify subgroup differences
- Implement longitudinal tracking of individual students
- Add qualitative components to understand the "why" behind the numbers
- Develop targeted surveys for identified at-risk groups
Research Timeline
Phase 1: Qualitative Data Collection
Conduct focus groups and interviews to gather in-depth student insights
Phase 2: Survey Refinement
Use qualitative findings to improve quantitative survey instruments
Phase 3: Expanded Data Collection
Implement improved surveys with broader demographic tracking
Phase 4: Policy Development
Develop targeted wellbeing policies based on comprehensive findings
Proposed Wellbeing Initiatives
- Targeted support programs for identified outlier groups
- Workload management strategies for high school students
- Enhanced advisor training based on student feedback
- Regular wellbeing check-ins rather than annual surveys
Project Resources
Skills Demonstrated
Research Design
Developed comprehensive mixed-methods research approach
Data Analysis
Applied statistical methods including ANOVA to educational data
Survey Methodology
Designed and implemented effective data collection instruments
Educational Leadership
Translated research findings into actionable policy recommendations